Website Traffic Analysis: The Complete 7-Step Method (2026)
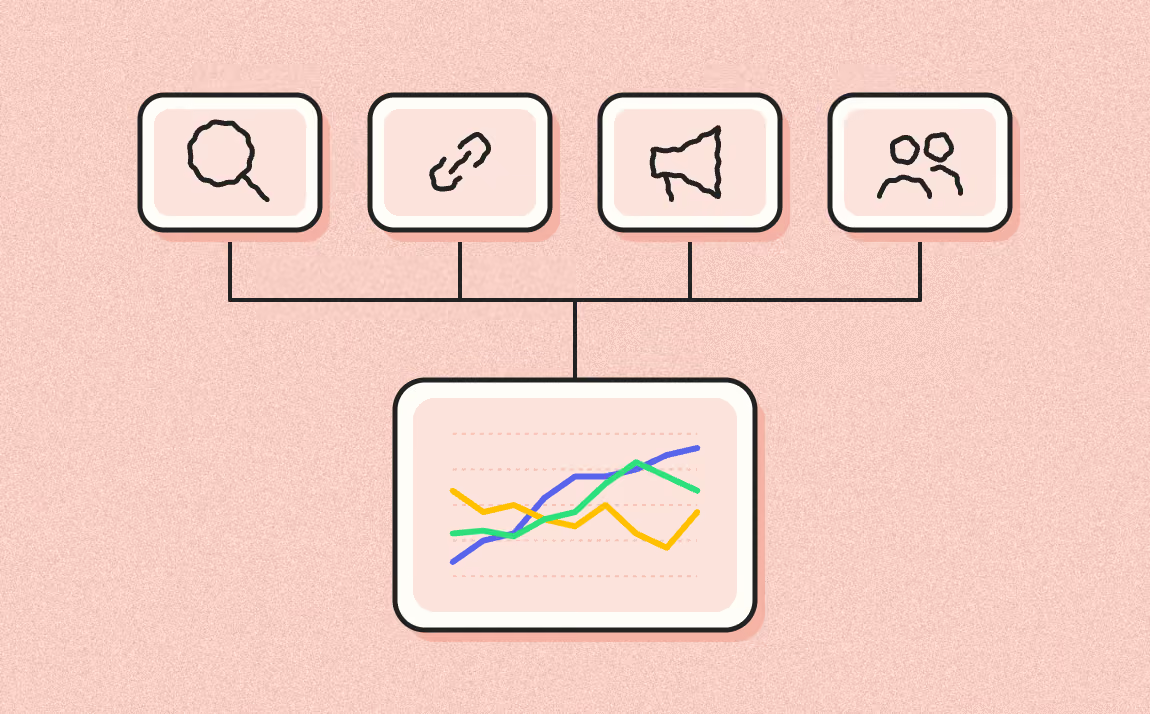
Analyzing a website's traffic means measuring the volume of visits, where they come from, and how visitors behave in order to identify the channels, pages, and journeys that genuinely contribute to the site's goals. The standard method rests on three complementary sources: an analytics tool for behavior, Google Search Console for organic visibility, and, when the level of diagnosis warrants it, server logs to observe the requests actually received by the infrastructure. In practice, a useful analysis comes down to seven steps: making analytics tracking reliable, framing a reference period, reading the volumes, breaking down the sources, identifying the pages that perform, connecting traffic to conversions, then formulating prioritized actions.
article summary
- Traffic analysis answers four essential questions: how many visits, where they come from, how visitors behave, and what results they generate.
- GA4 or an analytics alternative measures behavior; Search Console completes the picture for organic visibility.
- KPIs should be segmented by channel, landing page, and business objective rather than aggregated into a single global average.
- Consent, tracking configuration, blockers, and collection rules can create gaps between actual traffic and measured traffic.
- Traffic from ChatGPT can be isolated using the referrers and parameters actually observed in your analytics tool.
Want to take it further? Ask:
What Is Website Traffic Analysis?
Website traffic analysis is the process of collecting, segmenting, and interpreting visit data — volume, source, behavior, conversion — in order to guide marketing, editorial, or technical decisions. In other words: this isn't a reporting exercise, it's a decision-making exercise. If your numbers don't change what you do the following week, you're not analyzing, you're just watching.
Four questions structure any serious analysis. How many? The volume of users and sessions, and its trend. From where? Acquisition sources and channels: organic, direct, referral, paid, social, email. What? Landing pages, user journeys, the content that holds attention. To what result? The conversions generated, and their associated economic value. An analysis that stops at the first question is strictly useless — and yet that's the case for most of the reports we audit.
Traffic Analysis, Web Analytics, SEO Audit: What's the Difference?
These three terms overlap partially but don't cover the same scope. Web analytics is the general discipline: measuring visitor behavior on a digital property, with its own tools, naming conventions, and data governance. Traffic analysis is a subset of it, focused on inbound flows: how many visitors, through which channel, on which pages, with what level of engagement.
An SEO audit, on the other hand, is a technical and semantic diagnostic process: indexing, structure, performance, link building, editorial quality. It uses traffic data, but its focus is the site's ability to capture visibility, not reading the visits already acquired. In practice, the two feed into each other: a well-conducted SEO traffic audit identifies pages losing impressions in Search Console, and a technical SEO audit explains why.
Quantitative vs. Behavioral Analysis
Quantitative analysis answers "how many." It relies on aggregated volumes: active users, sessions, pageviews, sessions by channel, conversions. This is the foundation, the layer provided by GA4, Matomo, or Plausible. It can, for example, reveal that a page is losing significant traffic or that a referral channel is growing unusually fast.
Behavioral, or qualitative, analysis answers "why." It relies on heatmaps, session recordings, scroll and click analysis: Hotjar, Microsoft Clarity, Contentsquare. It can show that a significant share of visitors never reach your form, or that a visual element is getting clicks even though it isn't interactive. The two approaches aren't opposed: quantitative detects the anomaly, behavioral explains it. Working without the second is optimizing blind.
What Traffic Analysis Can't Tell You
Let's be clear about the limits, because this is where most teams lose their way. Your data won't tell you a visitor's exact intent: you infer it, you don't measure it. Nor will it tell you causality: a traffic increase coinciding with a campaign doesn't prove the campaign caused it, especially in a multichannel context with a data-driven attribution model that redistributes credit across touchpoints.
Nor do they provide an absolute truth about volumes: consent, blockers, collection rules, data thresholds, and filters can all change what gets measured. The size of the gap depends on the configuration and shouldn't be assumed in advance. Finally, they won't tell you what your visitors think. For that, you have to ask them. A well-placed exit survey sometimes delivers more than a quarter's worth of dashboards.
Which Metrics Should You Track to Analyze Website Traffic?
The classic trap is tracking everything. The result: thirty-page reports nobody opens, and decisions made on gut feel. A good audience analysis relies on a limited number of KPIs genuinely tied to the decisions at hand, rather than a dashboard that piles up every available metric. Here's the reference glossary, organized by family.
Volume Metrics: Users, Sessions, Pageviews
- Active users: the number of distinct users GA4 counts as active over the period, typically when they generate an engaged session or certain activity events. Where: GA4, "Acquisition" or "Overview" report. What it reveals: an order of magnitude for the audience the tool identifies. Pitfall: identification depends on configuration and available signals. The same individual may not be recognized consistently across devices or consent contexts.
- Sessions: all the interactions of a single user over a continuous period; in GA4, a session ends by default after 30 minutes of inactivity. Where: GA4, all acquisition reports. What it reveals: visit frequency and intensity of use. Pitfall: session timeout is configurable in GA4, so interpret session volume in light of your own settings and usage.
- Pageviews: the total number of page displays, reloads included. Where: GA4, "Pages and screens" report. What it reveals: site-wide browsing depth. Pitfall: taken in isolation, this metric says little about business value. It can be central for an ad-funded media site, but must be tied to conversions on a lead-generation site.
Engagement Metrics: Engagement Rate, Duration, Pages per Session
- Engagement rate: the share of engaged sessions. In GA4, a session counts as engaged if it lasts more than 10 seconds, includes a key event, or generates at least two page or screen views. Where: GA4, acquisition and page reports. What it reveals: how well the entry promise matches the content delivered. Pitfall: a high rate on a blog post says nothing about conversion likelihood.
- Average engagement time: how long the site is actually in the foreground in the browser. Where: GA4. What it reveals: reading depth. Pitfall: only compare it across pages of the same type. Comparing the time spent on a 2,500-word article with that of a contact page makes no sense.
- Pages per session: the average number of pages viewed per session. This metric gives a clue about browsing depth, without on its own measuring the quality of internal linking. A high value can reflect useful exploration or, conversely, confused navigation; interpret it according to the type of journey.
Acquisition Metrics: Sessions by Channel, Impressions, Clicks, CTR, Average Position
This is the heart of analyzing a website's traffic sources. In GA4, the "Traffic acquisition" report breaks sessions down by default channel group: Organic Search, Direct, Referral, Paid Search, Organic Social, Paid Social, Email, Affiliates. This breakdown is the first thing to look at, before everything else, because it shapes how every other metric should be read.
On the Search Console side, four indicators drive organic acquisition. Impressions measure your visibility: how many times your pages appeared in results. Clicks measure actual attractiveness. CTR (clicks ÷ impressions) measures how well your title and meta description match the expressed intent. Average position puts it all in context. A page that gains impressions but loses CTR deserves a check of the results page and snippet. The cause could be the title, a shift in intent, a new results format, or the overall makeup of the results page.
Tracking these indicators over time, with useful filters and period comparisons, is detailed in our method for monitoring your Google rankings with Search Console.
Outcome Metrics: Conversions, Conversion Rate, Value per Visit
- Conversions: events marked as key in GA4 (form submitted, quote requested, purchase, appointment booked). What it reveals: the actual productivity of your traffic. Pitfall: counting a 90% scroll or a click on a mailto link as a conversion muddies your entire steering.
- Conversion rate: conversions ÷ sessions, segmented by channel and landing page. What it reveals: the quality of your traffic, not just its quantity. Pitfall: an overall rate is a misleading average. The organic channel's rate on commercial pages is the metric that actually matters.
- Value per visit: revenue or pipeline generated ÷ number of sessions. What it reveals: the economic worth of a visit, which finally makes budget trade-offs possible. Pitfall: requires an assigned conversion value, even an approximate one. We come back to this further down.
The 4 Vanity Metrics to Stop Tracking
Some metrics take up space in reports without ever triggering a decision. Total site-wide pageviews, first: it climbs when you publish, drops when you stop, and says nothing about the value created. Monthly unique visitors, next — an internal-communication figure with weak technical reliability that hides every channel disparity.
Overall average position in Search Console is the third false friend: it aggregates thousands of heterogeneous queries, including low-stakes long tail, and can decline even as your strategic queries improve. Finally, an overall bounce rate can mask very different behaviors depending on page type. Read it alongside the engagement rate and segment both metrics by page type.
Which Tools Should You Use to Analyze Website Traffic?
The right question isn't "what's the best website traffic analysis tool," but "which roles do I need to cover." There are four: measuring behavior on your own site, understanding your visibility in search engines, estimating other people's traffic, and observing what your visitors actually do. One tool never substitutes for another role.
The Free Foundation: GA4 + Search Console + Looker Studio
Google Analytics 4 covers behavior: sessions, channels, pages, events, conversions, funnels, cohorts, and retention. Its setup is more demanding than Universal Analytics, but its event-based model is considerably more powerful once you feed the dataLayer correctly through Google Tag Manager.
A consistent tracking plan keeps you from steering the site with incomplete or poorly named events. A poorly configured GA4 produces unusable data: an incomplete setup can therefore badly skew how the data is interpreted.
Google Search Console covers organic acquisition upstream of the click: impressions, clicks, CTR, average position, indexing, Core Web Vitals, actual queries. It's the reference source for analyzing the impressions, clicks, queries, and pages observed in Google Search. Bing Webmaster Tools plays the same role for Bing, and has become strategic now that Copilot relies on that index.
Looker Studio covers reporting: connecting to GA4, Search Console, Google Ads, spreadsheets, and producing shared dashboards. It lets you build dashboards that are shared and legible for teams who don't use the analytics interfaces directly.
For many showcase sites, blogs, and service businesses, this trio is a sufficient base before adding specialized tools as needed. To pinpoint exactly where visitors on a Webflow site come from, see our method to detect traffic sources on Webflow.
Privacy-Friendly Alternatives
These solutions can address needs around hosting control, lean data collection, or operational simplicity. To qualify for a consent exemption in France, the purpose and configuration must, among other things, stay limited to audience measurement on behalf of the publisher and meet the other conditions published by the CNIL. Also check any data transfers involved and the settings actually enabled.
Their limitations are real too: fewer advertising integrations, no advanced data-driven attribution model, a more limited connector ecosystem, and a cost for high volumes on the cloud version. Self-hosted Matomo is free but assumes infrastructure you have to maintain. Cloudflare Web Analytics is an appealing minimalist option for a showcase site with no complex conversion needs.
Competitor Traffic Estimation Tools
Semrush (with Traffic Analytics), Ahrefs, and Similarweb estimate traffic for sites you don't own, based on browsing panels, ISP data, clickstream data, and modeling from organic rankings. These are estimates, not measurements. How far they diverge from actual data varies by site, market, and the tool's methodology. Use this data as comparative estimates, not as a substitute for proprietary analytics.
That doesn't make them useless: quite the opposite, they excel in relative terms. Comparing three competitors against each other, spotting a growth trend, identifying their most visible pages or the keywords where they're gaining ground — that's where these tools shine. Taking their monthly visit figure at face value in a business plan, on the other hand, is a mistake.
Qualitative and Behavioral Analysis Tools
Hotjar and Microsoft Clarity offer heatmaps, session recordings, and behavioral signals useful for complementing quantitative data, among other things. Check each plan's limits and conditions before choosing. Contentsquare plays in a higher league, with journey analysis and quantified impact scoring for every zone of a page, aimed at enterprise budgets.
For SaaS products, Amplitude and Mixpanel take over for product analytics: cohort retention, feature adoption, multi-session funnels. Adobe Analytics targets, among others, organizations with advanced segmentation and governance needs, with a generally heavier implementation.
Which Stack Should You Choose Based on Your Profile?
| Site profile | Recommended stack | Analysis priority |
|---|---|---|
| Showcase site / small business | GA4 + Search Console + Clarity | Traffic sources, forms submitted, service pages |
| Blog / media | GA4 + Search Console + Looker Studio + Ahrefs or Semrush | Landing pages, engagement rate, content decay |
| E-commerce | GA4 e-commerce + Search Console + Hotjar + Semrush | Purchase funnel, value per visit, paid vs. organic channels |
| B2B SaaS | GA4 + Search Console + Amplitude or Mixpanel + connected CRM | Traffic → MQL → SQL, cohorts, multi-touch attribution |
| Regulated sector | Matomo or Piwik PRO | Privacy, data governance, essential conversions |
How to Analyze Website Traffic in 7 Steps
A useful analysis follows a stable order: first check the quality of the measurement, then understand volumes, sources, pages, and business results before formulating actions. The goal isn't to comment on every fluctuation but to identify what deserves a decision.
1. Validate Tracking Before Interpreting the Numbers
Start by checking that your main events are firing correctly: page_view, forms, purchases, appointments booked, or other key events. Check recent changes to tags, your CMP, Tag Manager, and the tracking plan. Compare multiple sources when possible: a sharp drop in GA4 alongside stable Search Console clicks should first raise suspicion of a collection issue.
Also document your consent rules. In France, an audience measurement solution can be exempt from consent only under certain conditions, in particular when its purpose is strictly limited to audience measurement on behalf of the publisher and the CNIL's other criteria are met. So don't assume that a given tool or a "cookieless" mode automatically makes measurement complete or compliant.
2. Choose a Consistent Comparison Period
Compare periods that make sense for your business. A short view helps spot a recent anomaly; a longer period reduces daily noise; a year-over-year comparison helps neutralize seasonality when your industry is seasonal. Note the campaigns, public holidays, incidents, and deployments that could explain a break in the trend.
Avoid looking for a universal drop threshold. A 5% variation on a strategic commercial page can matter more than a 20% drop on content with no business value. Context and where the loss is concentrated matter more than a generic percentage.
3. Read the Volumes and Their Trends
Look at users, sessions, and views as contextual indicators, then quickly segment by channel, device, country, and page type. An overall average can hide two opposite movements, for example organic traffic declining while paid traffic rises.
Look for trend breaks, but don't interpret them in isolation. A rise in sessions is only positive if quality and goals follow suit. Conversely, a drop in volume can be acceptable if it involves poorly qualified visits while conversions stay stable.
4. Break Down Traffic Sources
In your analytics tool, examine sources, mediums, and channel groups. For SEO, complement this with Search Console to distinguish a drop in demand, a loss of impressions, a decline in CTR, or a shift in the pages ranking.
The "Direct" and "Referral" categories deserve particular attention. A direct attribution can include visits whose source wasn't correctly identified. Campaign links should use consistent UTM parameters to avoid mixing up channels. For emerging sources, build segments based on the referrers and parameters actually observed rather than a theoretical classification.
5. Identify Which Landing Pages Create or Destroy Value
Rank landing pages by channel, volume, engagement, and conversion. Spot the ones gaining impressions but not clicks, the ones attracting traffic without contributing to goals, and the ones converting well despite low volume.
For every anomaly, compare pages of the same type. A blog post, a product page, and a contact page don't have the same expected behavior. Analyzing by template keeps you from wrongly labeling a metric "good" or "bad" across the whole site.
6. Connect Traffic to Conversions and Business Value
Define the key events that genuinely correspond to an outcome: purchase, qualified lead, quote request, sign-up, trial, or another step in the journey. Then measure conversions by channel and by landing page.
When the economic value is available, calculate a suitable indicator: revenue per session for an e-commerce site, pipeline value per lead for a B2B business, or cost per acquisition for a campaign. Attribution models don't provide an absolute truth; use them as a consistent reading rule over time.
7. Turn the Analysis into an Action Plan
Finish with a short list of actions ranked by strength of evidence, potential impact, and effort. Each action should specify the signal observed, the hypothesis, the fix or test to run, and the KPI that will let you verify the outcome.
A good report doesn't just list numbers. It answers three questions: what changed, why is that change plausible, and what action should be taken next?
How Can You Make Traffic Data More Reliable?
Differences between tools are normal because they don't measure exactly the same things, nor with the same rules. Search Console reports interactions within Google Search; an analytics tool measures visits to the site based on its configuration; logs record requests received by the server or infrastructure.
Consent and Analytics Configuration
A CMP change can alter the measured volume without actual traffic changing in the same proportion. So watch for changes in consent, tag versions, and exclusion settings. In France, the consent exemption for certain audience-measurement trackers depends on a set of conditions and the actual configuration, not just the vendor chosen.
Bots, Spam, and Unidentified Traffic
Check for abnormal sources or hostnames, spikes that can't be tied to any campaign, and atypical behavior. Don't bulk-delete historical data: document your filters and apply them carefully to keep comparisons consistent.
GA4, Search Console, and Log Discrepancies
Don't try to reconcile the numbers down to the unit. Instead, compare trends and understand the scope of each source. A sudden divergence between two tools can become a diagnostic signal; a constant gap may simply come from their different measurement methods.
How Do You Analyze a Competitor's Website Traffic?
You can't access a competitor's proprietary analytics without authorization. Similarweb, Semrush, Ahrefs, and other tools provide estimates built from their own sources and models. This data is useful for comparing orders of magnitude, trends, and relative shares, but it shouldn't be presented as the competitor's actual session count.
Compare multiple signals: organic visibility, keywords, visible pages, links, estimated traffic trends, and any available public data. If two tools diverge sharply, keep that uncertainty rather than arbitrarily picking the figure that suits your narrative.
How Do You Analyze Traffic from ChatGPT and Generative Engines?
Treat generative assistants and engines as an acquisition source to measure separately once it becomes significant. For ChatGPT, some visits can be identified via the chatgpt.com referrer or parameters observed in your analytics tool; the measurement method should start from the data actually received.
Create a segment or channel grouping based on the parameters and domains actually observed. For other services, check the referrers present in your own data rather than assuming an identical convention applies. Some journeys may remain hard to attribute when referral context isn't passed through.
Don't confuse visibility with traffic. Being cited or mentioned in a generative answer doesn't guarantee a click; conversely, a referral visit doesn't prove your brand was cited in every prior answer. A GEO audit should therefore combine referral data, observation of brand presence, and analysis of cited sources whenever they're visible.
How Do You Diagnose a Drop in Web Traffic?
Start by checking the measurement, then locate the drop. Segment by channel, page, country, device, and period. A drop showing up only in GA4 with Search Console stable calls for a different diagnosis than a simultaneous fall in organic clicks and impressions.
For SEO traffic, then look at indexing, technical changes, deployments, affected queries, shifts in demand, and how the results pages are composed. Avoid automatically blaming a Google update or a content problem without evidence. When a drop specifically concerns SEO, a separate diagnosis lets you examine queries, pages, and technical or editorial causes in finer detail without mixing levels of analysis.
What Reporting Cadence Should You Adopt?
Frequency depends on how fast the business can change and the team's capacity to act. An e-commerce site running a campaign may need more frequent monitoring than a long-cycle B2B site. Keep operational alerts separate from steering reports.
An executive dashboard should stay compact: the trend of the main channels, the pages or clusters explaining the movement, conversions, business value, and planned actions. Operational teams can keep more detailed views for diagnosing causes.
Checklist for Analyzing Website Traffic
- Check that tags, key events, and consent rules are working as intended.
- Choose comparison periods compatible with seasonality and campaigns.
- Segment data by channel, landing page, device, and market when relevant.
- Compare GA4 or your analytics tool with Search Console for SEO topics.
- Identify the pages that genuinely explain the traffic increase or decrease.
- Connect visits to conversions and business value.
- Document significant technical, marketing, and editorial changes.
- Use competitor tools as estimates, not as proprietary analytics.
- Set up dedicated tracking for the AI referrers actually observed.
- End every analysis with prioritized actions and control KPIs.
Conclusion
Traffic analysis is only useful if it turns imperfect data into explicit decisions. First make collection reliable, segment volumes by source and page, connect them to conversions, then prioritize actions. Tools provide complementary signals: their value comes from the consistency of the method and the team's ability to act, not from the sheer quantity of numbers displayed.
FAQ
How Can You Analyze Your Own Site's Traffic for Free?
Google Search Console is free for performance data within Google Search. GA4 and Looker Studio also offer free tiers for many use cases. Depending on your privacy or governance needs, other analytics solutions can be considered, with different pricing and hosting models.
How Can You Find Out How Many Visitors a Competitor's Site Has?
You can't know its exact visitor numbers without access to its internal data. Competitive intelligence tools provide estimates that are mainly useful for comparing trends and orders of magnitude.
What's the Difference Between Users, Sessions, and Pageviews?
A user represents a person or a user identifier depending on the signals available; a session groups interactions over a period of activity; pageviews count page displays. These metrics answer different questions and should be read together.
What's a Good Bounce Rate?
There's no universal good rate. In GA4, bounce rate is the inverse of engagement rate. Compare pages of the same type and tie the metric to the page's goal rather than relying on a generic benchmark.
How Do You Measure Traffic from ChatGPT?
In your analytics tool, filter visits associated with chatgpt.com and the parameters actually observed. Keep a dedicated segment to track how this traffic evolves without assuming a universal attribution convention.
How Often Should You Analyze Your Traffic?
Adapt the frequency to your business cycle and the decisions you can actually make. Alerts can be frequent for critical indicators, while a weekly or monthly summary may be enough for steering, depending on the site.
Good to know
Heading
Lorem ipsum dolor sit amet, consectetur adipiscing elit. Suspendisse varius enim in eros elementum tristique. Duis cursus, mi quis viverra ornare, eros dolor interdum nulla, ut commodo diam libero vitae erat. Aenean faucibus nibh et justo cursus id rutrum lorem imperdiet. Nunc ut sem vitae risus tristique posuere.






.avif)





Lorem ipsum
Lorem ipsum dolor sit amet, consectetur adipiscing elit, sed do eiusmod tempor incididunt ut labore et dolore magna aliqua. Ut enim ad minim veniam, quis nostrud exercitation ullamco laboris nisi ut aliquip ex ea commodo consequat. Duis aute irure dolor in reprehenderit in voluptate velit esse cillum dolore eu fugiat nulla pariatur.